Web-mining and Clustering
Web-crawler and Text-mining Corporate Websites
For this task we adapted the web-mining methodology and analysis proposed by Papagiannidis, See-To [1]. As it is not practical or feasible to look-up and interpret the information on hundreds of web sites manually, an automated data collection system was developed. This was built with PHP (recursive backronym of PHP: Hypertext Preprocessor) and MySQL (Structured Query Language). PHP is a server-side scripting language designed for web development. The input for the data collection required only the web site address to be retrieved and the geographic location of the company’s registered address. Both were available from the IoT Companies Database. For our analysis we retrieved the home page and scanned for any links in the same domain (first level-scanning) contained in it. We only downloaded the web page code and not any images or other files associated with it, as we were interested in the text it contained. After checking that a valid request was obtained when requesting a page, we processed each page to strip any code, effectively leaving just the text for analysis. 9115 pages were marked for downloading for 401 websites/companies (i.e. about 23 pages per company). Once all pages were downloaded and processed, we combined the text and merged the pages into a single “document” that was to enter the analysis. When combining pages we removed pages that were not considered relevant such as privacy notices or terms and conditions. As a few pages were not available or returned no text, after combining pages we were left with 394 documents/companies to analyse. Finally, we processed the text by applying an extended mySQL stopwords list. We also removed web-page terms such as “Home page”, “Privacy policy” or “Contact us”, which were not expected to add significant meaning to the corpus. In addition, we removed brand names, country names, days/months and other similar terms that were not considered relevant. Finally, we replaced terms such as “IOT” and “INTERNET OF THINGS” with “INTERNETOFTHINGS”. This was to both ensure that a consistent representation of such terms was used and that the three terms were considered as one, simplifying the analysis and interpretation.
Analysis of Website Data
For the analysis of data, QDA Miner with its extension Wordstat was used, which made it possible to quantitatively analyse massive textual data. Having added the file with extracted data into the software, pre-processing procedures were required to improve the accuracy of the results. The pre-processing procedure concerned a manual check of the frequency list for excluding irrelevant concepts. The words for exclusion were analysed within the textual environment from which they had been derived to validate the irrelevance of the word for the analysis. The results of the analysis were produced in three formats: frequency extraction and visualisation, topic clustering and dendrograms. First, frequency extraction was conducted to visualise the concepts which are more dominant in the data. Second, topic clustering was performed. That enabled to us uncover the hidden thematic structure of a text, by using natural language processing and a statistical analysis. An NNMF extraction algorithm was applied for the extraction of keywords with the factor loading above 0.35, which ensured more precise and comprehensive topic modelling [2]. Third, the dendrograms, based on co-occurrence analysis, were produced. Co-occurrence analysis is based on Jaccard’s Index (JI) similarity coefficient defined as J = a/(a + b + c), where a is a paragraph of the document in which both words occur, and a , b and c represent the paragraphs where one of the words occur, but not the other [3].
Text mining results
The text mined from 394 websites consisted of 5,185,875 keywords. Table 1 presents the top 50 keywords represented by the frequency value, the percentage of processed terms calculated against the total number of words in the analysed documents, the number and the percentage of websites in which keywords occur and TF-IDF weight (the weighted term frequency adjusted against the inverse website frequency, containing this keyword). The results demonstrate that terms with the highest frequency are: data, services, Internet of Things, systems, security, solutions, applications, management, business support, sensors, software, development, cloud, control, smart and network. The frequency suggests that the majority of companies offer products, services and solutions revolving around business, support, data, systems, management, partners and applications. The design of software, control and security devices, digital platforms and technologies are also in the top popular offerings of the analysed companies.
Table 1: Frequency of top 50 keywords
FREQUENCY |
% PROCESSED |
NO. CASES |
% CASES |
TF IDF |
|
DATA |
38405 |
0.86% |
347 |
88.07% |
2118.7 |
SERVICES |
33883 |
0.76% |
340 |
86.29% |
2169.1 |
SYSTEMS |
30376 |
0.68% |
347 |
88.07% |
1675.7 |
SECURITY |
26371 |
0.59% |
300 |
76.14% |
3121.7 |
INTERNETOFTHINGS |
23903 |
0.53% |
217 |
55.08% |
6191.7 |
SOLUTIONS |
23825 |
0.53% |
339 |
86.04% |
1555.7 |
APPLICATION |
22411 |
0.50% |
325 |
82.49% |
1873.8 |
MANAGEMENT |
21789 |
0.49% |
339 |
86.04% |
1422.7 |
BUSINESS |
21534 |
0.48% |
348 |
88.32% |
1161 |
SUPPORT |
21310 |
0.48% |
349 |
88.58% |
1122.4 |
SENSOR |
20110 |
0.45% |
199 |
50.51% |
5965.5 |
SOFTWARE |
16103 |
0.36% |
303 |
76.90% |
1836.6 |
PARTNER |
16028 |
0.36% |
329 |
83.50% |
1255 |
DEVELOPMENT |
15985 |
0.36% |
306 |
77.66% |
1754.8 |
PRODUCTS |
15497 |
0.35% |
318 |
80.71% |
1442.3 |
CLOUD |
14710 |
0.33% |
225 |
57.11% |
3579.1 |
CONTROL |
12490 |
0.28% |
302 |
76.65% |
1442.5 |
SMART |
12490 |
0.28% |
274 |
69.54% |
1970.2 |
NETWORK |
11843 |
0.26% |
307 |
77.92% |
1283.3 |
DEVICES |
11842 |
0.26% |
301 |
76.40% |
1384.7 |
DIGITAL |
11784 |
0.26% |
294 |
74.62% |
1498.3 |
LOGGERS |
11374 |
0.25% |
19 |
4.82% |
14976.6 |
MOBILE |
11098 |
0.25% |
279 |
70.81% |
1663.5 |
CASE |
10093 |
0.23% |
272 |
69.04% |
1624.2 |
DESIGN |
10080 |
0.22% |
305 |
77.41% |
1120.9 |
MONITORING |
9962 |
0.22% |
254 |
64.47% |
1899.4 |
TEMPERATURE |
9606 |
0.21% |
121 |
30.71% |
4925.1 |
POWER |
9344 |
0.21% |
273 |
69.29% |
1488.8 |
PLATFORM |
9158 |
0.20% |
288 |
73.10% |
1246.4 |
METERS |
8733 |
0.19% |
90 |
22.84% |
5600.1 |
WIRELESS |
8616 |
0.19% |
171 |
43.40% |
3123.3 |
ENERGY |
8383 |
0.19% |
226 |
57.36% |
2023.6 |
TESTING |
8327 |
0.19% |
185 |
46.95% |
2734 |
TECHNOLOGIES |
7997 |
0.18% |
283 |
71.83% |
1149.2 |
RESOURCES |
7526 |
0.17% |
253 |
64.21% |
1447.8 |
INNOVATION |
7447 |
0.17% |
248 |
62.94% |
1497.2 |
SECURE |
7256 |
0.16% |
248 |
62.94% |
1458.8 |
TRAINING |
6105 |
0.14% |
232 |
58.88% |
1404.2 |
PRESSURE |
6065 |
0.14% |
138 |
35.03% |
2763.3 |
INDUSTRIAL |
6063 |
0.14% |
189 |
47.97% |
1934.3 |
ENTERPRISE |
5909 |
0.13% |
202 |
51.27% |
1714.5 |
ANALYTICS |
5883 |
0.13% |
185 |
46.95% |
1931.5 |
CONNECTIVITY |
5639 |
0.13% |
174 |
44.16% |
2001.5 |
INFRASTRUCTURE |
5546 |
0.12% |
237 |
60.15% |
1224.3 |
HEALTH |
5529 |
0.12% |
236 |
59.90% |
1230.7 |
WEB |
5401 |
0.12% |
248 |
62.94% |
1085.8 |
DOWNLOAD |
5236 |
0.12% |
246 |
62.44% |
1071.1 |
OFFICE |
5182 |
0.12% |
244 |
61.93% |
1078.4 |
DEVELOPERS |
5144 |
0.11% |
186 |
47.21% |
1676.9 |
ENGINEERING |
5018 |
0.11% |
219 |
55.58% |
1279.9 |
2.3.1 Topic Clustering
To understand the relationship of the extracted keywords, topic clustering was performed, which thematically grouped keywords based on the strength of their association with each other. The analysis produced fifteen clusters, presented in table 2. The topic column contains labels, which are automatically assigned to the clusters, based on their highest factor loading. The keywords column lists all keywords meeting the factor loading cut-off criteria in the descending order of factor loading. The frequency column provides the total frequency of all items listed in the keywords column. The cases column includes the statistics on the number of websites containing at least one of the keywords in the cluster, while the column labelled %cases displays the percentage of websites with at least one of the keywords in the cluster.
Out of fifteen clusters, three cover above 90% of cases, with their keywords emerging on almost all websites. For example, the biggest cluster is software and platform, which appears in 99.75% of cases. The analysis of the cluster suggests that 393 companies are involved in or related to the design of platforms and software, apps and server development, web cloud infrastructure, innovation and resources monitoring, IoT and connectivity, automation technologies, security and digital technologies, mobile and smart devices, artificial intelligence and analytics, data support systems, security control or other products and solution development applied in business services.
The second cluster of keywords frequently reoccurring on company’s websites relates to temperature and humidity. 92.13% of websites (363 companies) mention technologies, like remote sensors, meters, solar batteries, low-power network technologies and alarms, for controlling and monitoring the environmental resources, such as temperature, water, air, humidity, lighting and energy. The keywords in the cluster demonstrate the focus of those companies on programmable solutions based on IoT, enabling the wireless connectivity of devices. The keywords from the education & construction cluster reoccur in 90.61% of cases, meaning that 357 websites refer to technologies for learning, teaching and construction.
CCTV Wi-Fi and fleet vehicle are two clusters of words appearing in almost 60% of cases. For example, the concepts clustered into CCTV and Wi-Fi occur on 238 websites, which means that these companies produce or deploy internet-enabling technology or internet-based monitoring systems, including wireless Wi-Fi, CCTV systems, routers, broadband, fire protection, door entry technology and Ethernet. Keywords from the websites of 235 companies fall into the fleet and vehicle cluster. They produce automotive devices, such as fuel management, GPS tracking and telematics systems, parking and driver safety solutions.
The Vodafone UMTS and Siretta Telit clusters represent the group of companies producing wireless and satellite technologies. Particularly, their keywords refer to smart and cellular devices, telematics and wireless technologies designed for smart cities. The technologies from these groups appear at least on every fourth and at most on every second website.
The remaining clusters make up a maximum of 10% of the sample, representing minority products, like 1) industrial smart grid and solutions for challenging environments (Meggitt and Landys gyr), 2) industrial electric equipment for power, light, humidity, temperature and water pressure measurement and industrial automation solutions (loadcell VDC and boardapci hygroclip), 3) data storage, blockchain and IT infrastructure management solutions (NXT Oneview and codesigning unbound). The Actility Semtech and ADAS Visiongain clusters represent self-titled companies, engaging in business intelligence and IoT networks management.
Table 2: Topic clusters
TOPIC |
KEYWORDS |
FREQ |
CASES |
% CASES |
SOFTWARE PLATFORM |
SOFTWARE; PLATFORM; CLOUD; ENTERPRISE; DATA; WEB; TECHNOLOGIES; INFRASTRUCTURE; MANAGED; DEVELOPMENT; INNOVATION; ANALYTICS; AUTOMATION; APPLICATION; SERVER; DIGITAL; RESOURCES; APPS; SOLUTIONS; FINANCIAL; CONSULTANCY; SERVICES; SYSTEMS; MANAGEMENT; DEVELOPERS; MOBILE; SECURITY; PARTNER; SUPPORT; BUSINESS; CONTROL; SECURE; SMART; MARKETING; NETWORK; CASE; DESIGN; TESTING; HEALTH; PRODUCTS; ARTIFICIALINTELLIGENCE; POWER; TRAINING; HYBRID; ASSET; STORAGE; OFFICE; CHANNEL; INTERNETOFTHINGS; LEADERSHIP; MONITORING; FLOW; TRACKING; CYBER; DEVICES; WHITEPAPER; CONSUMER; MOBILITY |
288662 |
393 |
99.75% |
TEMPERATURE HUMIDITY |
TEMPERATURE; HUMIDITY; BATTERY; SENSOR; BATTERIES; WIRELESS; POWERSUPPLY; VIBRATION; MM; AIR; CABLE; INDUSTRIAL; METERS; USB; BLUETOOTH; REMOTE; WATER; ENERGY; MONITORING; VOLTAGE; MODBUS; DISPLAY; WIFI; ALARM; PROGRAMMABLE; CONNECTIVITY; RS; LIGHTING; ANTENNA; ETHERNET; PROBES; POWER; DEVICES; LORA; INTERNETOFTHINGS; SOLAR; ELECTRIC; VDC |
84321 |
363 |
92.13% |
EDUCATION CONSTRUCTION |
EDUCATION; CONSTRUCTION; EXECUTIVE; WASTE; FIRE; CENTRE; MEDIA; HIRE; GAS; LIVERPOOL; AIR; WATER; HEALTH; CITY; CLOSE; OFFICE; ELECTRIC |
22445 |
357 |
90.61% |
CCTV WIFI |
CCTV; WIFI; ROUTER; ETHERNET; DOORENTRY; BACKUP; BROADBAND; WIRELESS; SIM; AUDIO; FIRE; PROTECTION; DUAL |
15052 |
238 |
60.41% |
FLEET |
FLEET; VEHICLE; DRIVER; TELEMATICS; FUEL; SAFETY; TRACKING; PARKING |
10407 |
235 |
59.64% |
VODAFONE |
VODAFONE; UMTS; SMARTCITIES; LTE; CELLULAR; GCF; TELEMATICS; SIRETTA; TELIT; SATELLITE; WIRELESSLOGIC; INTERNETOFTHINGS |
16127 |
214 |
54.31% |
SIRETTA |
SIRETTA; TELIT; GL; USB; KIT; KITS; RASPBERRYPI; MM; GCF |
5808 |
95 |
24.11% |
LOADCELL |
LOADCELL; VDC; THERMOCOUPLE; TRANSDUCERS; SUBMERSIBLE; TORQUE; INCLINOMETER; OMEGA; VORTEX; DIFFERENTIAL; ULTRASONIC; DATALOGGING; CONVERTERS; WEATHERSTATION; TRANSMITTERS; LOGGERS; ISA; MINIATURE; BOARDAPCI; HYGROCLIP; KELLER; MSR; TINYTAG |
16886 |
43 |
10.91% |
ACTILITY |
ACTILITY; SEMTECH; THINGPARK; LORAWAN; ADLINK; LORA |
3604 |
25 |
6.35% |
ADAS |
ADAS; VISIONGAIN; ENSIGMA; POWERVR; ESD; BLUERIVER; IOTSF; CATAPULT; SEMTECH; SOLIDSTATE |
5133 |
25 |
6.35% |
NXT |
NXT; ONEVIEW; SOGETI; BLOCKCHAIN |
2064 |
23 |
5.84% |
MEGGITT |
MEGGITT; ZULU; GAMMA; HEATERS; THERMOCOUPLE |
2518 |
12 |
3.05% |
BOARDAPCI |
BOARDAPCI; HYGROCLIP; KELLER; MSR; TINYTAG; GMX; PYRANOMETER; ECOMM; OMEGA; SUBSEA |
6667 |
7 |
1.78% |
LANDIS |
GYR; LANDIS; XPRESS; HEATERS |
1975 |
6 |
1.52% |
CODESIGNING |
CODESIGNING; UNBOUND; CRYPTO |
1391 |
5 |
1.27% |
Co-occurrence analysis
The co-occurrence analysis illustrates the proximity of keywords in text, making it possible to explain the hierarchical relationship between the extracted concepts (Fig 1). The frequency of each keyword represents a horizontal bar. Colours represent clusters to which keywords belong. The keywords are aggregated into “branches” (links connecting words into hierarchies). While the vertical orientation of keywords along the dendrogram is irrelevant for interpretation, the height of each branch (horizontal lines) indicates the similarity of the aggregated keywords, whereby the lower the height, the closer the keywords in text. The analysis of the mined data from websites produced one big cluster of interrelated concepts and a number of low-frequency clusters.
Figure 1a demonstrates a broad cluster with four central themes. The overarching theme revolves around the co-occurrence of the two pairs of keywords: 1) Internet of Things and Connectivity and 2) remote and sensors. The frequency of those keywords and the height of the branches indicate their similarity in terms of usage within the context and the appearance of these words as a pair on many websites. The hierarchy demonstrates the “parental” relation of these keywords to many other concepts in the cluster, which might suggest the element of IoT in all technologies/services in the group. For example, IoT and connectivity of devices through remote sensors have applications in storage, industrial manufacturing and urban engineering (i.e. smart cities). The companies push forward the industrial IoT concept by offering connectivity between machines, infrastructure and management systems, to streamline business operations. IoT in cities is realised by connecting sensors detecting flood, parking slots, congestion and other indicators of city dynamics to generate data and feed it into the network of intelligent systems. The bottom branch of the theme is retail, which is also linked to the artificial intelligence and analytics pair of keywords on the top of the dendrogram. Such a relationship demonstrates the use of IoT, artificial intelligence and predictive analytics for the automation of retail business, the management and analysis of retail platforms’ data. The IoT theme also comprises keywords related to services, such as consultancy, testing and safety, suggesting that companies might offer strategic advice on IoT implementation.
The second theme in the cluster is formed by the relationship between three pairs of keywords, reflecting the focus of companies on business services, data systems support and management solutions. That is the densest theme in the cluster as illustrated by the number of high-frequency keywords aggregated close to each other. There is close proximity of other keywords, such as application, product, development, design and network. On one hand, the picture suggests that there are organisations offering IoT implementation for product development processes. IoT enables companies to generate data on the usage of products and feeds it back to the organisation to make rapid improvements in products' design. On the other hand, the theme may suggest that an IoT provider offers the development and delivery of pre-configured IoT products and applications for different business sectors to meet their needs.
The third theme with high frequency is centred on the platform and software keywords, which are closely related to security, digital and technology. The keywords in this theme resemble the Software and Platform cluster produced as a result of the topic clustering analysis (table 2). Given the high frequency of the security keyword, it seems that the design and development of platforms is often associated with security purposes. For example, special security platforms and software are designed for protecting data and controlling the network of connected technologies. Branches of the theme spreading to the bottom of the dendrogram mostly concern technological devices, such as mobile devices, power, smart, innovation, suggesting the type of technology on which platforms are offered to be deployed.
The fourth theme, revolving around the words cloud, web, secure and infrastructure, reflects the focus of many companies on addressing security issues in cloud infrastructure.The result indicates that there are companies offering cloud security. Cloud security is a set of procedures, policies and technologies that are integrated to protect cloud and web-based systems, data and infrastructure, to ensure the regulatory compliance and safeguard the privacy of all stakeholders involved.
Fig 1a: Co-occurrence analysis of extracted keywords
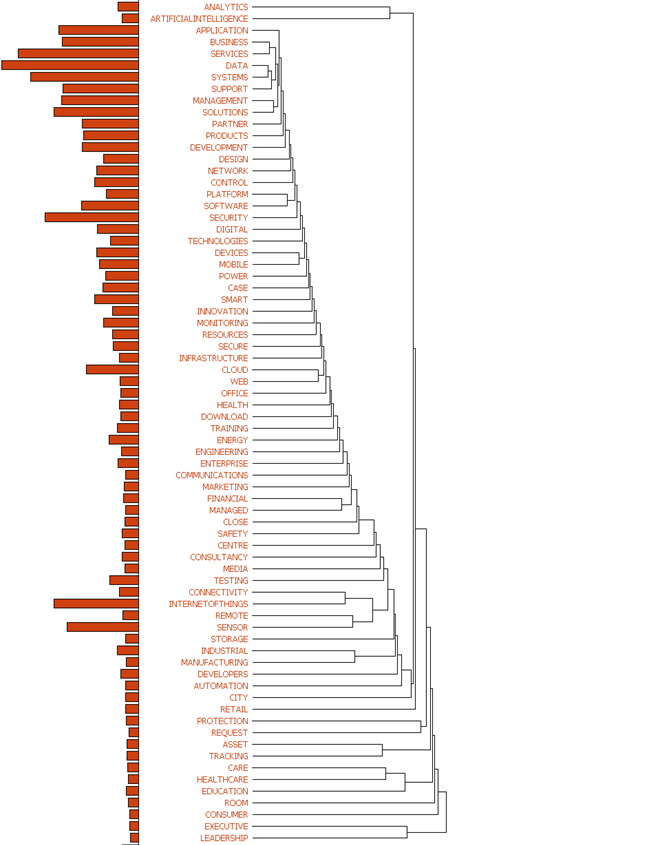
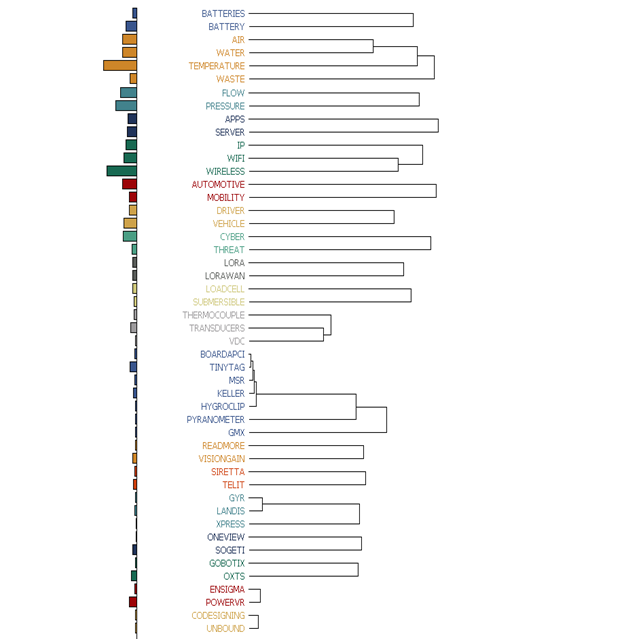
Figure 1b shows nineteen small low-frequency clusters with paired keywords. A review of these clusters makes it possible to discern the features/functions of technologies as well as the nature of the services these companies provide. For example, several companies produce and implement devices assessing water flow pressure. The cluster with air, water, temperature and waste concepts points to products helping manage waste water and measure the level of water/moisture in the air, humidity and temperature in different production processes. Some companies focus on IoT activation product features, like app servers. Others offer technology and solutions enabling the communication of devices, such as LoRaWAN and LoRa, wireless wifi and IP. The cyber threat cluster implies that companies analyse cybersecurity threats and provide cybersecurity solutions. The clusters like automotive mobility and vehicle driver point to IoT applications for an automotive industry segment.
Figure 1b: Co-occurrence analysis of extracted keywords
References
1. Papagiannidis, S., et al., Identifying industrial clusters with a novel big-data methodology: Are SIC codes (not) fit for purpose in the Internet age? Computers & Operations Research, 2018. 98: p. 355-366.
2. Chen, J., S. Feng, and J. Liu, Topic sense induction from social tags based on non-negative matrix factorization. Information Sciences, 2014. 280: p. 16-25.
3. Tan, P.-N., Introduction to data mining. 2006: Pearson Education India.